


The S&P 500 index has continued to hover just below its still-rising 200-day moving average.
When the S&P SPX, -1.48% first broke down below 4420, it accelerated briefly, giving the bears some fuel. But then it quickly found support and has bounced around in a range that is slightly greater than 100 points for over a week.
A 100-point range is nothing these days, so this is essentially a very indecisive market, marked with some large up and down days, but little change overall.
The SPX chart remains in a downtrend, as noted by the sloping blue lines on the accompanying chart. The minor support and resistance are at 4370 and 4630 (the thinner red, horizontal lines on the chart), while major support and resistance are at 4100-4200 and 4700-4800, respectively.
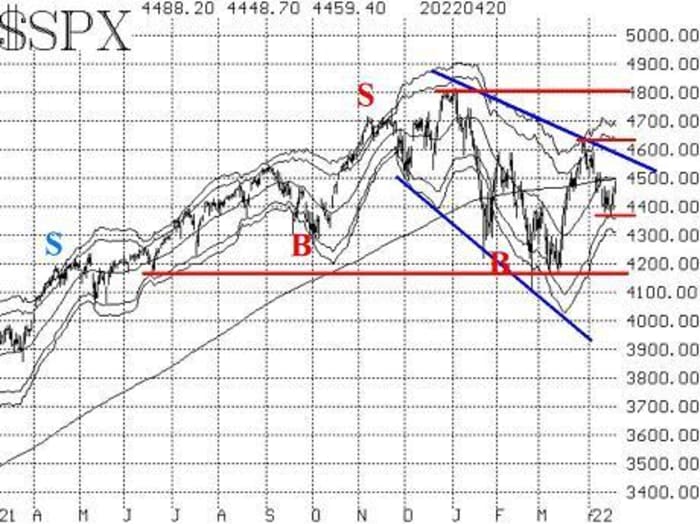
The “modified Bollinger Bands” (mBB) are moving sideways now, and they have contracted somewhat since realized volatility continues to decline. There is not a McMillan Volatility Band (MVB) signal in existence at this time.
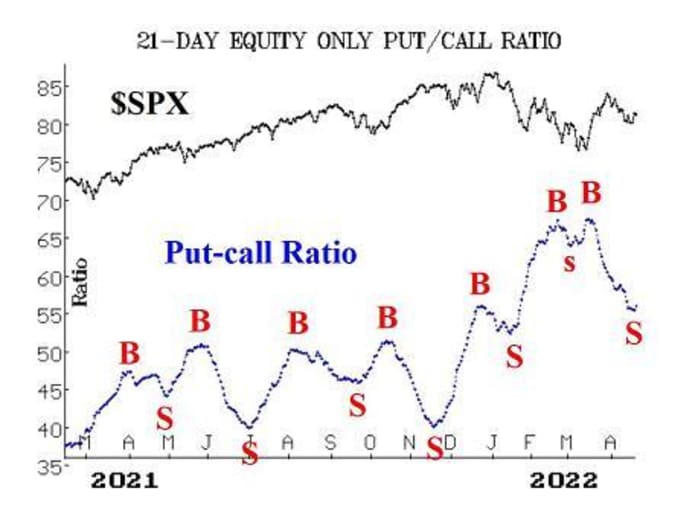
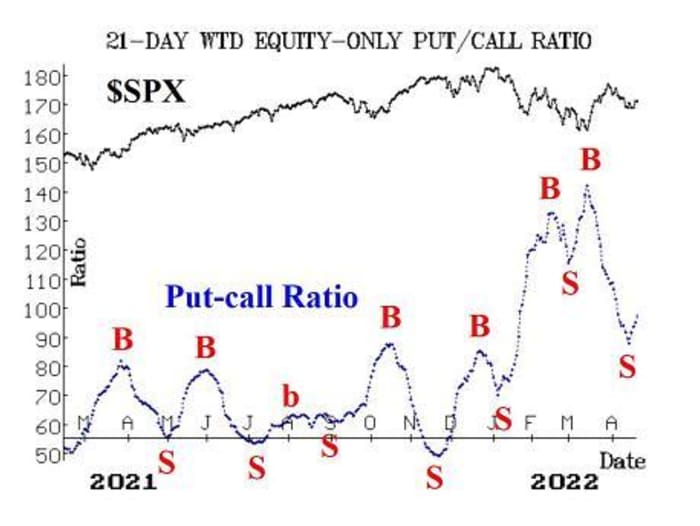
Equity-only put-call ratios are on sell signals. The weighted ratio unexpectedly turned higher a few days ago, and our computer analysis programs grade it as a “sell” signal now. The standard ratio has now curled higher, and it too, is rolling over to a sell signal.
If they make new relative lows, that would cancel out these recent sell signals, but this is an interesting development. It should also be noted that individual stock put-call ratios are generating a lot of sell signals as well.
Market breadth has been flipping back and forth, failing to sustain a trend. That is nothing new, as it has been doing that all year. Most recently, there have been breadth oscillator sell signals on April 5, buy signals on April 13, then a descent back to a sell signal and finally for the last two days, buy signals. This is too much whipsaw action to be traded in a weekly publication such as this newsletter, but it is an example of the indecisiveness in the market overall.
New 52-week lows continue to dominate new 52-week highs across all three of our data sets (NYSE, NASDAQ, and “stocks only”). Only on Wednesday did new highs rise above new lows, with new highs being greater than 100. If this persists for another day, then this indicator will roll over to a buy signal.
The volatility complex has been more favorable toward stocks, although not completely so. There was VIX “spike peak” buy signal on April 7, and then there was another “spike peak” buy signal on April 13. We do not trade the second, or overlapping, signal, but we have taken positions in line with the first buy signal.
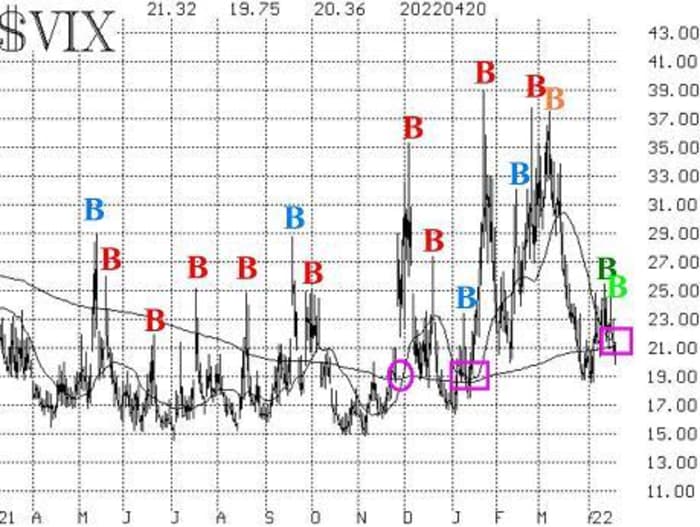
The trend of VIX VIX, +11.61% is still negative though, but just barely. The trend would turn positive if both VIX and its 20-day moving average were to cross below the 200-day MA. The square on the lower right of the accompanying chart shows just how close the 20-day is to such a cross below the 200-day MA.
However, a similar situation in mid-January (another box on the chart) was never completed, and the market fell sharply from there.
In fact, VIX’s 20-day MA has not been below the 200-day MA since late last November (the circle on the accompanying chart). A close by VIX below 20 would likely be enough to generate a buy signal here.
The construct of volatility derivatives remains bullish for stocks. The front-month VIX futures is now the May contract, since April expired on April 20. We are now watching the relationship between May and June. As long as May is trading at a lower price than June, that is positive for stocks. Moreover, the terms structures of both the VIX futures and of the CBOE Volatility Indices continue to slope upward – another positive sign for stocks.
In summary, the indicators remain mixed, as SPX is flopping back and forth in a relatively narrow range. The situation will not be resolved definitively until SPX either breaks out over 4638 or falls below 4100.
At the current time, we have new sell signals from the put-call ratios (usually a trustworthy indicator), and new buy signals from the breadth oscillators (normally, a short-term signal). The decisive factor might be a change of trend in VIX – that is, the 20-day MA closing below the 200-day MA.
However, to wait for that could be a mistake, especially in a weekly publication. So we are going to set up a conditional recommendation.
New recommendation: Conditional SPY spread
Today, SPX is up sharply in premarket trading – partly on news of the strong earnings in Tesla TSLA, +3.23% – and that might be enough to change the trend of VIX. But if the market can’t hold these gains, then the sell signals in the equity-only put-call ratios should be heeded. Basically, if the trend of VIX changes today or Friday, then we will take a bullish position. But if it does not, we will take a bearish position.
IF VIX closes below 19.00 on either April 21 or April 22,
THEN
Buy 2 SPY May (20th) at-the-money calls
And sell 2 SPY May (20th) calls with a striking price 13 points higher.
However, if VIX fails to close below 19 on either of those dates, then we want to take on a new bear spread:
IF VIX does not close below 19.00 on either of the next two days,
THEN
Buy 2 SPY May (20th) at-the-money puts
And sell 2 SPY May (20th) puts with a striking price 25 points higher.
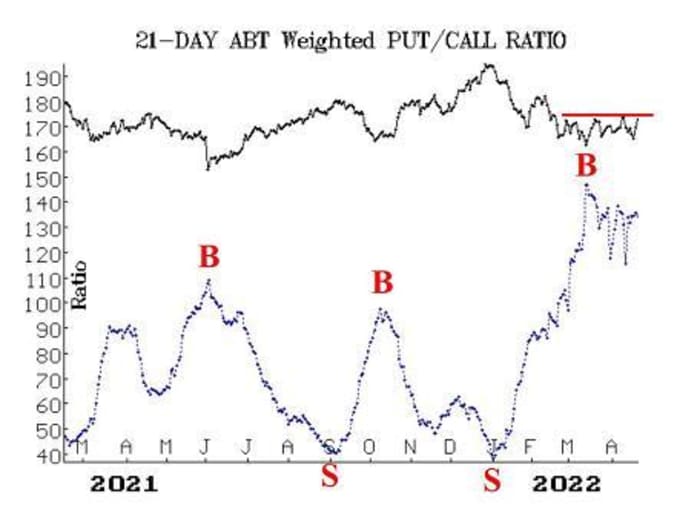
New recommendation: Abbott Labs
A new put-call ratio buy signal was generated in Abbott Labs ABT, +0.60% ABT over a month ago. However, the stock has been stuck in a range and has not been able to fulfill the prospects of that buy signal. The put-call ratio has remained high (i.e., in oversold territory) as ABT has traded sideways over that time. If it can break out to the upside, we want to own it.
IF ABT closes above 124.50,
THEN buy 2 ABT June (17th) 125 calls
ABT: 122.64
Follow-up action
All stops are mental closing stops unless otherwise noted.
We are going to implement a “standard” rolling procedure for our SPY spreads: in any vertical bull or bear spread, if the underlying hits the short strike, then roll the entire spread. That would be roll up in the case of a call bull spread, or roll down in the case of a bear put spread. Stay in the same expiration, and keep the distance between the strikes the same unless otherwise instructed.
Long 2 ZEN May (20th) 125 calls and short 2 May (20th) 140 calls: The stock gapped to the upside when Zendesk ZEN, -2.58% began to evaluate strategic alternatives. Hold without a stop while the activist activity is in progress.
Long 2 ORCL May (20th) 82.5 calls: We bought calls near the close of trading on March 15, when Oracle ORCL, -1.01% closed above 78, and later rolled up. The put-call ratio buy signal is beginning to fade, so set a closing stop at 78.50, basis ORCL common.
Long 0 KSS Apr (14th) 62.5: These calls expired worthless last week, and we are not going to replace them, since option volume has begun to fade in Kohl’s KSS, -3.25%.
Long 2 FRT May (20th) 125 calls: Hold as long as the put-call ratio remains on a buy signal, as it is continuing to do.
Long 2 SPY May (6th) 449 calls and short 2 SPY May (6th) 464 calls: This spread was bought in line with the most recent VIX “spike peak” buy signal of April 7. Stop yourself out if VIX closes above 24.78.
Long 3 SAVE May (20th) 25 calls: Hold without a stop for now, as competing bids are still in place for Spirit Airlines SAVE, +0.28%.
Long 2 ENV May (20th) 80 calls: Option volume has remained active. Continue to hold without a stop while the takeover rumors play out.
NOTE: the LIDR conditional call buy did not take place, since AEye LIDR, -3.98% did not close above 6. The takeover rumors have died down, so cancel this recommendation.
Send questions to: lmcmillan@optionstrategist.com.
Lawrence G. McMillan is president of McMillan Analysis, a registered investment and commodity trading advisor. McMillan may hold positions in securities recommended in this report, both personally and in client accounts. He is an experienced trader and money manager and is the author of the bestselling book “Options as a Strategic Investment“.
Disclaimer: ©McMillan Analysis Corporation is registered with the SEC as an investment advisor and with the CFTC as a commodity trading advisor. The information in this newsletter has been carefully compiled from sources believed to be reliable, but accuracy and completeness are not guaranteed. The officers or directors of McMillan Analysis Corporation, or accounts managed by such persons may have positions in the securities recommended in the advisory.
from WordPress https://ift.tt/veFlZ3X
via IFTTT
No comments:
Post a Comment